Python中文网 - 问答频道, 解决您学习工作中的Python难题和Bug
Python常见问题
可能是我搞不懂,或者是在用rotation绘制text()到{
我的代码如下:
from pylab import *

# =================== deltaV-vs-trust
figure( figsize=( 12, 8 ) )

times     = array( [ 1.0,  60.0, 3600.0, 86400.0, 604800,  2592000, 31556926, 315569260,  3155692600  ] )
timeText  =        [ 'sec','min','hour', 'day',   'week',  'month', 'year',   '10years',  '100years'  ]
dists     = array( [ 1e+1,  1e+2,  1e+3,  1e+4,  1e+5,     1e+6,    6371e+3, 42164e+3, 384400e+3,  1e+9,       1e+10,       5.790918E+010, 1.082089E+011, 1.495979E+011, 2.279366E+011, 7.784120E+011, 1.426725E+012, 2.870972E+012, 4.498253E+012, 1.40621998e+13, 2.99195741e+14, 7.47989354e+15,  4.13425091e+16 ] )
distText  =        [ '10m','100m', '1km','10km', '100km', '1000km', 'LEO',   'GEO',    'Moon',     r'10$^6$km',r'10$^7$km', 'Mercury',       'Venus',       'Earth',        'Mars',     'Jupiter',      'Satrun',      'Uranus',     'Neptune',   'Heliopause', 'Inner Oorth',   'Outer Oorth', 'Alpha Centauri' ]

vMin = 1e+0; vMax = 1e+8;
aMin = 1e-4; aMax = 1e+2;

As = linspace(aMin,aMax,2); print As
Vs = linspace(vMin,vMax,2); print Vs
As_ = As.copy(); Vs_ = Vs.copy()

for i in range(len(dists)):
    dist = dists[i]
    ts    = sqrt( 2*dist / As )
    As_[:] = As [:]
    Vs_    = As * ts
    if( Vs_[0] < Vs[0] ):
        Vs_[0] = Vs[0]
        As_[0] = Vs_[0]**2 / (2*dist)
    plot( Vs_, As_, 'b-', alpha=0.5 )
    plt.text( Vs_[0], As_[0], distText[i], rotation=60, color='b', horizontalalignment='center', verticalalignment='bottom')     # this does not work properly
    #plt.text( Vs_[0], As_[0], distText[i], rotation=60, color='b', horizontalalignment='center', verticalalignment='center')     # this works but does not look nice
    #plt.text( Vs_[0], 1.5*As_[0], distText[i], rotation=60, color='b', horizontalalignment='center', verticalalignment='center')  # a bit better

for i in range(len(times)):
    time = times[i]
    As_[:] = As[:]
    Vs_ = As * time
    if( Vs_[1] > Vs[1] ):
        Vs_[1] = Vs[1]
        As_[1] = Vs_[1] / time
    plot( Vs_, As_, 'r-', alpha=0.5 )
    plt.text(  Vs_[1], As_[1], timeText[i]+"  ", rotation=40, color='r',  horizontalalignment='right', verticalalignment='baseline')

ylabel( r" acceleration [m/s$^2$] " )
xlabel( r" delta-v      [m/s  ] " )
yscale('log')
xscale('log')
grid()
ylim( aMin, aMax )
xlim( vMin, vMax )

show()
结果如下所示(您可以看到文本在相应的行中的位置不正确;对于Inner Oorth、Outer Oorth和Alpha Centauri非常明显):

我认为这个问题只在大旋转角度下才可见。如果我使用horizontalalignment='center', verticalalignment='center'它可以正常工作,但是它看起来不太好(因为行穿过文本,文本穿过图像的边界)
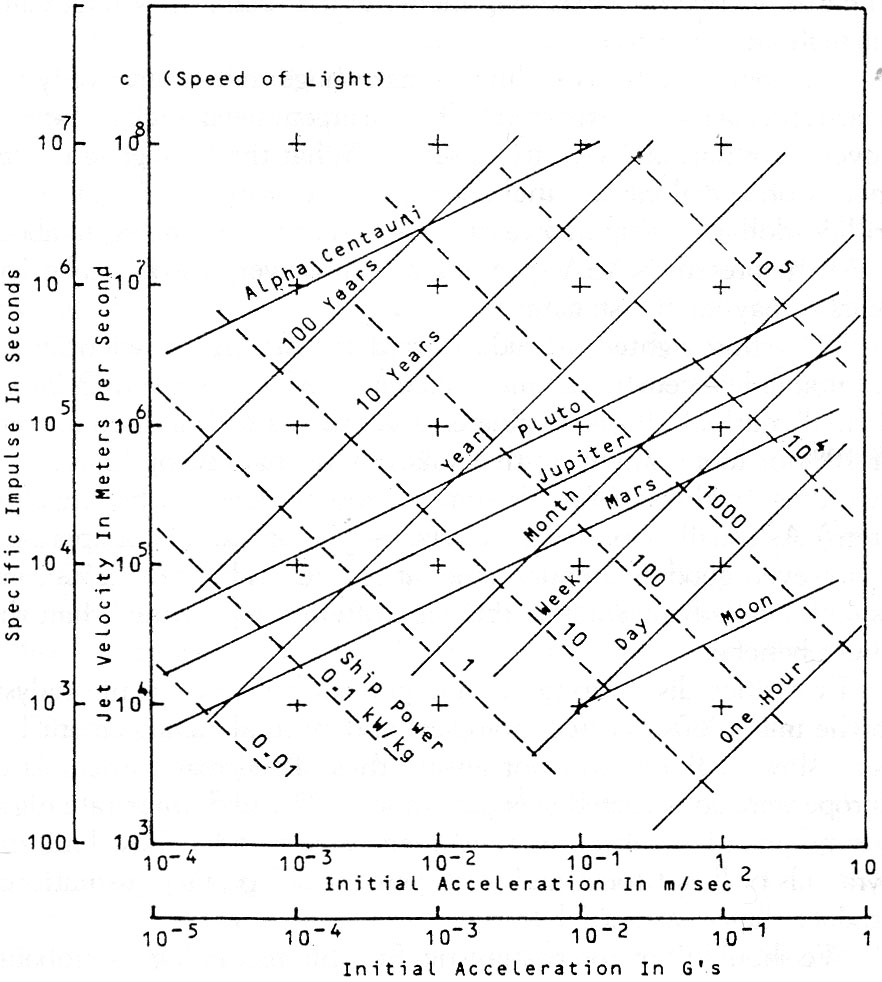
只是为了上下文-我要做的是这样的情节: http://www.projectrho.com/public_html/rocket/images/enginelist/torchChart.jpg
Tags: textaspltcolorvscentertimesrotation
热门问题
- 文本导入时标题行中的特殊字符
- 文本小部件:在没有输入时更新并在循环后保持空闲
- 文本小部件tkin
- 文本小部件tkinter中的标签更改或文本外观更改是否有撤消功能?
- 文本小部件tkinter复制图像选项
- 文本小部件上的Python Tkinter ttk滚动条未缩放
- 文本小部件上的滚动条可能需要根据制表符ord显示前进行滚动
- 文本小部件不显示lis中的内容
- 文本小部件不显示Unicode字符
- 文本小部件中写入的行间距
- 文本小部件中的文本作为变量
- 文本小部件中的滚动条仅显示在底部
- 文本小部件中的选项卡键空间计数
- 文本小部件作为Lis
- 文本小部件在主框架中扩展列宽
- 文本小部件未使用删除功能清除
- 文本小部件滚动动画(Tkinter、Python)
- 文本居中。格式正确吗?
- 文本差分算法
- 文本已知时音频文件中的单词索引
热门文章
- Python覆盖写入文件
- 怎样创建一个 Python 列表?
- Python3 List append()方法使用
- 派森语言
- Python List pop()方法
- Python Django Web典型模块开发实战
- Python input() 函数
- Python3 列表(list) clear()方法
- Python游戏编程入门
- 如何创建一个空的set?
- python如何定义(创建)一个字符串
- Python标准库 [The Python Standard Library by Ex
- Python网络数据爬取及分析从入门到精通(分析篇)
- Python3 for 循环语句
- Python List insert() 方法
- Python 字典(Dictionary) update()方法
- Python编程无师自通 专业程序员的养成
- Python3 List count()方法
- Python 网络爬虫实战 [Web Crawler With Python]
- Python Cookbook(第2版)中文版
关键是
'rotation_mode'kwarg到text(doc),直到今晚我才知道它的存在。此控件的作用是如果文本先旋转,然后对齐(默认设置)或对齐,然后旋转。在为了理解你的问题,我把你的代码清理到(或多或少)符合pep8,并简化了一些计算。在
相关问题 更多 >
编程相关推荐