Python中文网 - 问答频道, 解决您学习工作中的Python难题和Bug
Python常见问题
我想在TabPy中创建一些代码,计算列中单词的频率,并删除Tableau中单词云的停止词
在Python中,我可以很容易地做到这一点:
other1_count = other1.answer.str.split(expand=True).stack().value_counts()
other1_count = other1_count.to_frame().reset_index()
other1_count.columns = ['Word', 'Count']

### Remove stopwords
other1_count['Word'] = other1_count['Word'].apply(lambda x: ' '.join([word for word in x.split() if word not in (stop)]))
other1_count['Word'].replace('', np.nan, inplace=True)
other1_count.dropna(subset=['Word'], inplace=True)
other1_count = other1_count[~other1_count.Word.str.contains("nan")]
但不太确定如何通过Tabby运行此功能。有谁熟悉Tabby,知道我怎么跑吗
提前谢谢
Tags: 代码intruecountnan单词word频率
热门问题
- 文本导入时标题行中的特殊字符
- 文本小部件:在没有输入时更新并在循环后保持空闲
- 文本小部件tkin
- 文本小部件tkinter中的标签更改或文本外观更改是否有撤消功能?
- 文本小部件tkinter复制图像选项
- 文本小部件上的Python Tkinter ttk滚动条未缩放
- 文本小部件上的滚动条可能需要根据制表符ord显示前进行滚动
- 文本小部件不显示lis中的内容
- 文本小部件不显示Unicode字符
- 文本小部件中写入的行间距
- 文本小部件中的文本作为变量
- 文本小部件中的滚动条仅显示在底部
- 文本小部件中的选项卡键空间计数
- 文本小部件作为Lis
- 文本小部件在主框架中扩展列宽
- 文本小部件未使用删除功能清除
- 文本小部件滚动动画(Tkinter、Python)
- 文本居中。格式正确吗?
- 文本差分算法
- 文本已知时音频文件中的单词索引
热门文章
- Python覆盖写入文件
- 怎样创建一个 Python 列表?
- Python3 List append()方法使用
- 派森语言
- Python List pop()方法
- Python Django Web典型模块开发实战
- Python input() 函数
- Python3 列表(list) clear()方法
- Python游戏编程入门
- 如何创建一个空的set?
- python如何定义(创建)一个字符串
- Python标准库 [The Python Standard Library by Ex
- Python网络数据爬取及分析从入门到精通(分析篇)
- Python3 for 循环语句
- Python List insert() 方法
- Python 字典(Dictionary) update()方法
- Python编程无师自通 专业程序员的养成
- Python3 List count()方法
- Python 网络爬虫实战 [Web Crawler With Python]
- Python Cookbook(第2版)中文版
我认为熟悉与Tableau相关的Python的最好方法是Tableau社区上的这个(旧)线程:
https://community.tableau.com/s/news/a0A4T000002NznhUAC/tableau-integration-with-python-step-by-step?t=1614700410778
它一步一步地解释了初始设置以及如何通过Tableau计算字段“调用”Python
此外,您将在文章顶部找到对更新更多的Tabby GitHub存储库的引用: https://github.com/tableau/TabPy
我在R工作过一个项目,完成了一些非常类似的事情。这里有一个视频示例,展示了概念验证(没有音频)https://www.screencast.com/t/xa0yemiDPl
它本质上显示了使用Tableau交互检查选定国家的word cloud中葡萄酒描述的最终状态。主要组成部分是:
高层概述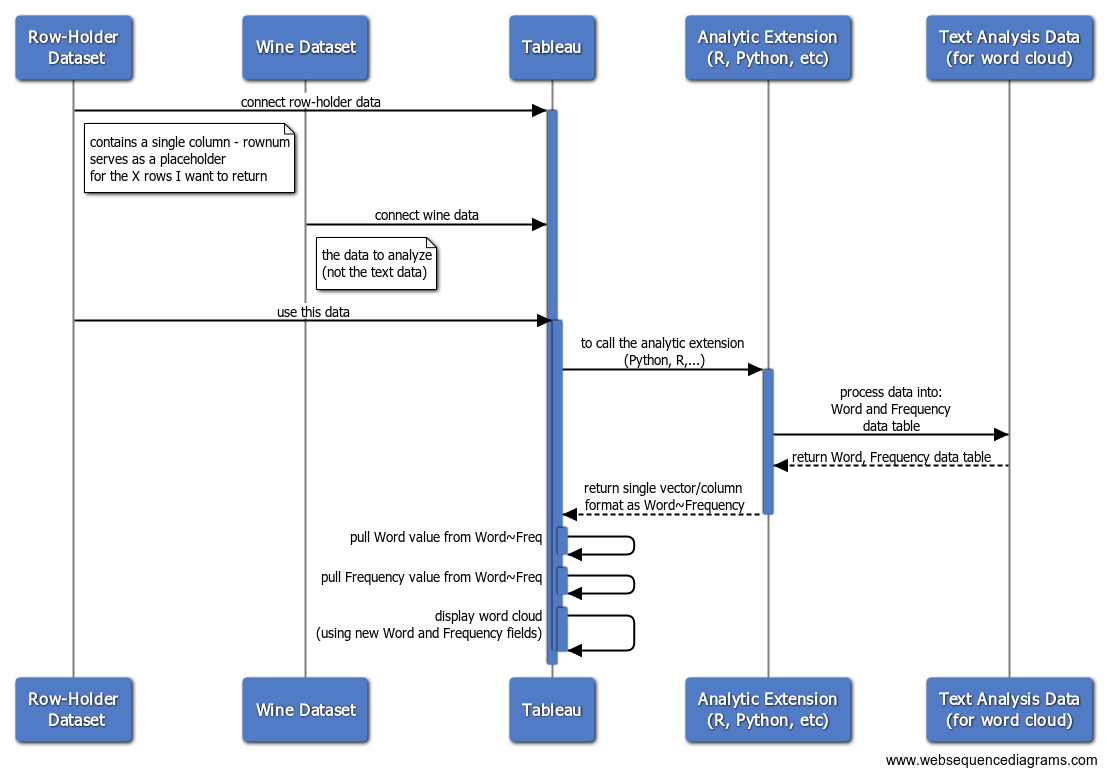
表格计算字段-[R字+频率]:
Tableau单词值的计算字段:
表格频率值的计算字段:
如果您不熟悉Tableau,您可能希望与公司的Tableau分析师一起工作,他们将帮助您创建计算字段并配置Tableau以连接到Tabby
相关问题 更多 >
编程相关推荐